Mexicans are Largest Hispanic Group Nationwide and in 40 States
On May 26, 2011 the U.S. Census Bureau released a 2010 Census brief on the nation's Hispanic population, which shows the Hispanic population increased by 15.2 million between 2000 and 2010 and accounted for more than half of the total U.S. population increase of 27.3 million. Between 2000 and 2010, the Hispanic population grew by 43 percent, or four times the nation's 9.7 percent growth rate.
The Hispanic Population: 2010 brief looks at an important part of our nation's changing ethnic diversity with a particular focus on Hispanic origin groups, such as Mexican, Dominican and Cuban.
Detailed Hispanic Origin Distribution
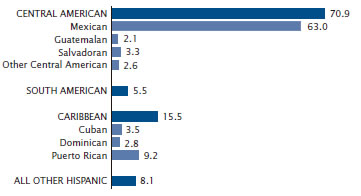 About three-quarters of Hispanics in the United States reported as Mexican, Puerto Rican or Cuban origin in the 2010 Census. Mexican origin was the largest group, representing 63 percent of the total U.S. Hispanic population — up from 58 percent in 2000. This group increased by 54 percent and saw the largest numeric change (11.2 million), growing from 20.6 million in 2000 to 31.8 million in 2010. Mexicans accounted for about three-fourths of the 15.2 million increase in the total Hispanic population between 2000 and 2010
The Mexican origin population represented the largest Hispanic group in 40 states, with more than half of these states in the South and West regions of the country, along with two states in the Northeast and all 12 states in the Midwest.
Puerto Ricans, the second largest group, comprised 9 percent of the Hispanic population in 2010 — down from 10 percent in 2000. The Puerto Rican population grew by 36 percent, increasing from 3.4 million to 4.6 million. Puerto Ricans were the largest Hispanic group in six of the nine states in the Northeast and in one western state — Hawaii, with a population of 44,000.
The Cuban origin population increased by 44 percent, growing from 1.2 million in 2000 to 1.8 million in 2010. Cubans made up approximately 4 percent of the total Hispanic population in both the 2000 and 2010 Censuses and were the largest Hispanic origin group in Florida in 2010 with a population of 1.2 million.
Since 2000, three detailed Hispanic origin groups surpassed a population of 1 million: Salvadoran (1.6 million), Dominican (1.4 million) and Guatemalan (1.0 million).
Regional Geographic Distribution
The Hispanic population grew in every region of the United States between 2000 and 2010, and most significantly in the South and Midwest. The South saw a 57 percent increase in its Hispanic population, which was four times the growth of the total population in the South (14 percent). Significant growth also occurred in the Midwest, where the Hispanic population grew by 49 percent. This was more than 12 times the growth of the total population in the Midwest (4 percent).
While the Hispanic population grew at a slower rate in the West and Northeast, the regions still saw significant growth between 2000 and 2010. The Hispanic population grew by 34 percent in the West, which was more than twice the growth of the total population in the West (14 percent). The Northeast's Hispanic population grew by 33 percent, or 10 times the growth of the total population in the Northeast (3 percent).
States
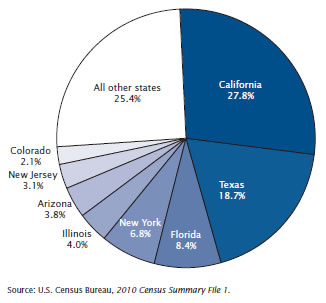 More than half of the Hispanic population in the United States resided in just three states: California, Texas and Florida. In 2010, 37.6 million, or 75 percent, of Hispanics lived in the eight states with Hispanic populations of 1 million or more: California, Texas, Florida, New York, Illinois, Arizona, New Jersey and Colorado. Hispanics in California accounted for 28 percent (14.0 million) of the total Hispanic population, while the Hispanic population in Texas accounted for 19 percent (9.5 million). Hispanics in Florida accounted for 8 percent (4.2 million) of the U.S. Hispanic population.
The Hispanic population experienced growth between 2000 and 2010 in all 50 states and the District of Columbia. In eight states in the South (Alabama, Arkansas, Kentucky, Maryland, Mississippi, North Carolina, South Carolina and Tennessee) and in South Dakota, the Hispanic population more than doubled in size between 2000 and 2010. Even with this large growth rate, the percentage of Hispanics in 2010 in each of these states remained less than 9 percent, far below the national level of 16 percent.
Hispanics in New Mexico comprised 46 percent of the total state population, the highest proportion for any state. Hispanics were 16 percent or more of the state population (matching or exceeding the national level) in eight other states: Arizona, California, Colorado, Florida, Nevada, New Jersey, New York and Texas.
Counties
Hispanics were the majority of the population in 82 out of the nation's 3,143 counties. In the South, Hispanics were the majority in 51 Texas counties and one Florida county (Miami-Dade). In the West, Hispanics were the majority in 12 New Mexico counties, nine California counties and two counties in each of the following states: Arizona (Santa Cruz and Yuma), Colorado (Conejos and Costilla) and Washington (Adams and Franklin).
In the Midwest, Hispanics were the majority in two Kansas counties (Ford and Seward), and in the Northeast, Hispanics were the majority in one New York county (Bronx).
Counties with the highest proportions of Hispanics were concentrated in bands along the states bordering Mexico — Texas, New Mexico, Arizona and California.
Concentrations of Hispanics were also found outside these border states. In particular, Hispanic concentrations were found in counties within central Washington; in Kansas, Idaho, Oklahoma, Nebraska and Colorado; around Chicago and along the East Coast from New York to Virginia; in central and southern Florida; and the District of Columbia.
The Hispanic population increased to more than twice its size since 2000 in at least one of every four counties. Of the 3,143 counties in the United States, Hispanics at least doubled in population size in 912 of them. Among the 469 counties with at least 10,000 or more Hispanics in 2010, the top five fastest growing counties were Luzerne, Pa. (479 percent change); Henry, Ga. (339 percent change); Kendall, Ill. (338 percent change); Douglas, Ga. (321 percent change); and Shelby, Ala. (297 percent change).
Editor's note: “People of Mexican origin” refers to people who report their origin as Mexican. It can include people born in Mexico, in the United States, or in other countries. This holds true for all the detailed Hispanic origin groups discussed in the brief (e.g., people of Cuban origin, Salvadoran origin, etc). The question on Hispanic origin is an ethnicity question and not a place of birth question. All Hispanic origin responses are based on self-identification. Throughout the brief, terms such as “Mexican origin” and “Mexicans” as well as “Cuban origin” and “Cubans” are used interchangeably, and in all cases refer to the ethnic origin of the person, not exclusively their place of birth or nationality.