| Minority Business Community At-A-GlanceA | ||||
| Business Owner | Number of Firms | Gross Receipts ($1000s) | Average Gross Receipts | Paid Employees |
| African American | 10,039 | $634,558 | 63,209 | 5,441 |
| American Indian & Alaska Native | 9,106 | 830,456 | 91,199 | 6,788 |
| Asian American | 16,333 | 4,529,479 | 277,321 | 31,339 |
| Native Hawaiian & Pacific Islander | Data not released | Data not released | N/A | Data not released |
| Hispanic American | 52,667 | 8,004,494 | 151,983 | 54,530 |
| All Minority | 85,227 | 14,183,639 | 166,422 | 99,176 |
| MBDA CLIENT ASSISTANCE BY SECTOR | ||||||
|  | Private Sector | Federal Government | State Government | Local Government | Not Disclosed | Total |
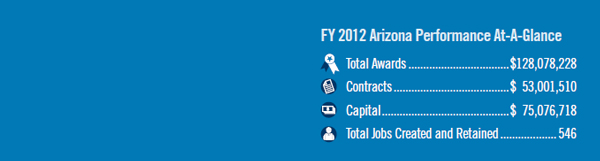
| Dollar Value of Contracts | $12,048,614 | $33,564,144 | – | $6,575,941 | $812,810 | $53,001,510 |
| Dollar Value of Capital | 17,980,307 | 57,096,411 | – | – | – | $75,076,718 |
| Number of Contracts | 60 | 43 | – | 7 | 1 | 111 |
| Number of Capital Transactions | 22 | 63 | – | – | – | 85 |
| TOTAL TRANSACTIONS | 82 | 106 | – | 7 | 1 | 196 |
| MBDA CLIENT ASSISTANCE BY INDUSTRY | ||
| Number of Transactions | Value of Transactions | |
| Construction | 79 | $39,698,814 |
| Manufacturing | 1 | 10,750.00 |
| Mining | 1 | 269,650.00 |
| Retail Trade | 4 | 186,938.00 |
| Services | 108 | 87,746,398.00 |
| Wholesale Trade | 3 | 165,679.00 |
» Download FY2012 Report for Arizona
Performance’
Published on: 19/04/2017