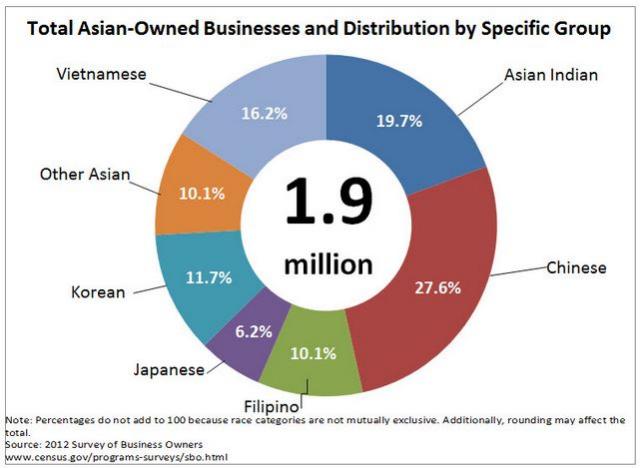
Between 2007 and 2012, the number of U.S. businesses owned by Asian-Americans rose 23.8 percent, from 1.5 million to 1.9 million.
In contrast, the total number of all U.S. firms increased only 2.0 percent during the same period, from 27.1 million to 27.6 million. As a result, 6.9 percent of all businesses were Asian-owned in 2012, up from 5.7 percent five years earlier. Asian business ownership is defined as having persons of Asian Indian, Chinese, Filipino, Japanese, Korean, Vietnamese or other Asian origin (such as Hmong, Laotian, Thai, Pakistani or Cambodian) owning 51.0 percent or more of the stock or equity in a nonfarm business operating in the United States. According to U.S. Census Bureau population estimates, Asians accounted for 5.8 percent of the 18 or older population in 2012. Censuses and surveys permit respondents to select more than one race; the 5.8 percent figure pertains to those who said they were either Asian only or Asian in combination with one or more other races.

The rate of increase in receipts for Asian-owned firms also outpaced that of all firms. Asian-owned firms totaled $699.5 billion in receipts in 2012, an increase of 38.2 percent from $506.0 billion in 2007. In contrast, receipts for all firms grew 11.7 percent during the same period, from $30.0 trillion in 2007 to $33.5 trillion in 2012.
These statistics come from the 2012 Survey of Business Owners, which provides a broad socio-economic picture of business owners across the nation. The Survey of Business Owners is part of the Census Bureau’s fiveyear economic census, conducted in years ending in two and seven.
The Survey of Business Owners not only identifies the race of business owners, but also their nationality, or Asian group. Each specific Asian group saw the rate of increase between 2007 and 2012 in the number of firms they owned outpace the national average: Asian Indians (up 22.4 percent), Chinese (up 24.8 percent), Filipinos (up 18.5 percent), Japanese (up 10.0 percent), Koreans (up 16.8 percent), Vietnamese (up 35.7 percent) and other Asians (up 34.3 percent). Asian Indians owned 377,486 firms (19.7 percent of all Asian-owned firms) and had receipts of $227.1 billion (32.5 percent of all Asian-owned firm receipts). Chinese owned 528,702 firms (27.6 percent) and had receipts of $210.1 billion (30.0 percent). Filipinos owned 193,336 firms (10.1 percent), with receipts of $25.8 billion (3.7 percent). Japanese owned 119,163 firms (6.2 percent), with receipts of $44.2 billion (6.3 percent). Koreans owned 224,891 firms (11.7 percent), with receipts of $107.8 billion (15.4 percent). Vietnamese owned 310,864 firms (16.2 percent), with receipts of $34.6 billion (5.0 percent). Other Asians owned 194,061 firms (10.1 percent), with receipts of $50.2 billion (7.2 percent).
Over half (52.0 percent) of Asian-owned businesses were male-owned (996,606 out of 1,917,902) in 2012. However, there were a couple of Asian subgroups (based on nationality) in which the numbers of male- and female-owned businesses were roughly equal. Women-owned businesses accounted for about half (51.1 percent) of both Filipino- and Vietnamese-owned businesses (with 98,849 out of 193,336 Filipino-owned businesses and 158,958 out of 310,864 Vietnamese-owned businesses).
California was home to more Asian-owned businesses than any other state in 2012 with 604,870, followed by New York (243,105) and Texas (155,784). Asian-owned firms comprised 62.6 percent of all firms in Honolulu County, Hawaii, which had the highest proportion of Asian-owned businesses among the 50 most populous counties in 2012 — Queens, N.Y., and Santa Clara, Calif., followed, at 34.5 percent and 34.4 percent, respectively. Also in 2012, San Jose, Calif., ranked first among the 50 most populous cities in the proportion of Asian-owned businesses, as they comprised 37.3 percent of all businesses (29,023 out of 77,832 businesses).
Asian-owned businesses comprised roughly 1 in 5, or 18.7 percent (156,391 out of 834,182) of firms in the accommodations and food services sector (NAICS 72). They also accounted for around 10.0 percent of all firms in two other sectors: other services (NAICS 81), with 10.6 percent (or 385,583 out of 3.6 million firms) and wholesale trade (NAICS 42), with 9.5 percent (67,062 out of 703,666). The majority of Asian-owned businesses in the other services sector (212,238 out of 385,583) were in the hair, nail and skin care services industry.
This is just a small snapshot of data available from the Survey of Business Owners. These same data are available at the more specific industry level (down to the six-digit NAICS), broken out by employer and nonemployer firms, and include additional variables, such as size of firms by receipts and employment levels. Drawing on a sample of 1.75 million employer and nonemployer businesses, the Survey of Business Owners publishes data on the number of firms, receipts, payroll and employment, as well as the gender, ethnicity, race and veteran status of the firm owners. Geographic detail, down to the economic place, is also available. This survey is the most comprehensive source of economic data on businesses by the demographic characteristics of the owners.
Cross post from Census Bureau


